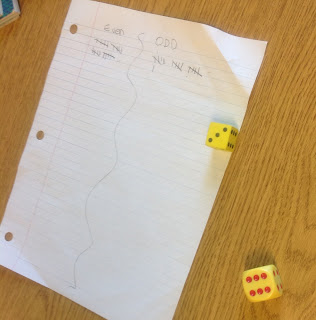
Each pair of students conducted fifty trials. Then we tallied all of the trials for the class and determined the Experimental Probability. Next, I showed them how to create a tree diagram for the two dice, and we determined all of the possible outcomes. Students could see that if you found the sum of the two dice, exactly half of the total number of outcomes were even, (18/36) and half were odd. So we called this a "fair game" because each student had a 50% chance of winning.
Today, they played the "odds and evens" game again, but we changed one of the rules. Once again, they each had a number cube and they played with a partner. This time, when they rolled the dice, they had to find the product of the two numbers rolled. Again, one of them had to choose "even" and the other "odd". I asked them first to predict whether or not they thought this would be a "fair game". They all believed that, like with the sum game, this would be a fair game.
It was so fun walking around the room and listening to their conversations as they played. They weren't long into it when I started hearing: "This game can't be fair!" So I walked around the room asking them them questions:
- Do you still think this is a fair game? Why or why not? How can you tell?
- Why do you think "even" is winning?
- What is your experimental probability? Is it what you expected?
It was so much fun to walk around the room and hear the learning as it was happening. They were so excited when they discovered that both numbers rolled had to be odd in order to end up with an odd product!
I asked them to conduct 40 trials. (I like to use different numbers of trials so that they get used to finding percentages with different denominators.) When they had completed all of their trials, they calculated the Experimental Probability.
I then asked them to find the Theoretical Probability for the experiment. It was very interesting. They all made their tree diagrams correctly. They all knew that there were 36 possible outcomes. And yet, out of 10 groups, only 2 correctly found the Theoretical Probability. They all determined that there were 27 even outcomes and only 9 odd outcomes. But they used 40 as their denominator again.
The last step in the question asked them to find the Theoretical Probability for 500 trials. They understood they needed to use equivalent fractions, but as they had been using a denominator of 40, their answers were not quite right.
During the consolidation, I asked one of the groups with the wrong answer to step forward and explain their theoretical probability. The two groups who did it properly, at first, began to doubt themselves. Why did most of the class get a different answer than they did? A lively conversation ensued. But soon enough, they realized what the majority of the class did wrong - that they had used 40 (the number of trials in our experiment) vs 36 (the total number of possible outcomes) for their denominator.
I'm hoping that because they constructed their own understanding and clarified their own misconceptions, it will be understood and remembered!


Nice experiment, but seems about Grade 4 difficulty: only odd x odd = odd, other 3 combos are even, for a probability of odd = 1/4. Finding the solution by counting (9/36) is an even less sophisticated solution, maybe Grade 3.
ReplyDeleteHi There, thanks so much for taking the time to comment. I LOVE it when people comment!
ReplyDeleteYou are right, that parts of this activity could be used in Grade Four, however, adding in the component of having to compare the Theoretical Probability to the Experimental Probability along with having to answer the question: "How many times would you expect to get an even number if you rolled 500 times?" increases the level of difficulty for this activity.
Perhaps our Curriculum Expectations are slightly different than your Common Core Standards. Here is the Grade Six expectation I was addressing with this lesson:
– predict the frequency of an outcome of a simple probability experiment or game, by calculating and using the theoretical probability of that outcome. (e.g.,“The theoretical probability of spinning red is 1/4 since there are four different-coloured
areas that are equal. If I spin my spinner 100 times, I predict that red should come up about 25 times.”). (Sample problem:
Create a spinner that has rotational symmetry. Predict how often the spinner will land on the same sector after 25 spins.
Perform the experiment and compare the prediction to the results.).
increases the level of difficulty for this activity.
ReplyDeleteTank addicting games